China Property Signals (#25): Explaining The Gap - Primary vs Secondary Home Price Indices Across 70 Cities
About this Newsletter: Get a quick but more granular view of (still) one of the most important sectors in China, with the weekly chart and commentary from Real Estate Foresight (REF) - drawing on 14+ years of REF's research on China housing markets.
The differences between new and secondary home price growth rates are significant.
This scatter chart shows the official NBS price growth indices (Y/Y) for 70 major cities for new homes (Y axis) and secondary homes (X axis), on the same scales. With the latest February data (March data is due this week).
The further away from the 45-degree line, the bigger the gap.
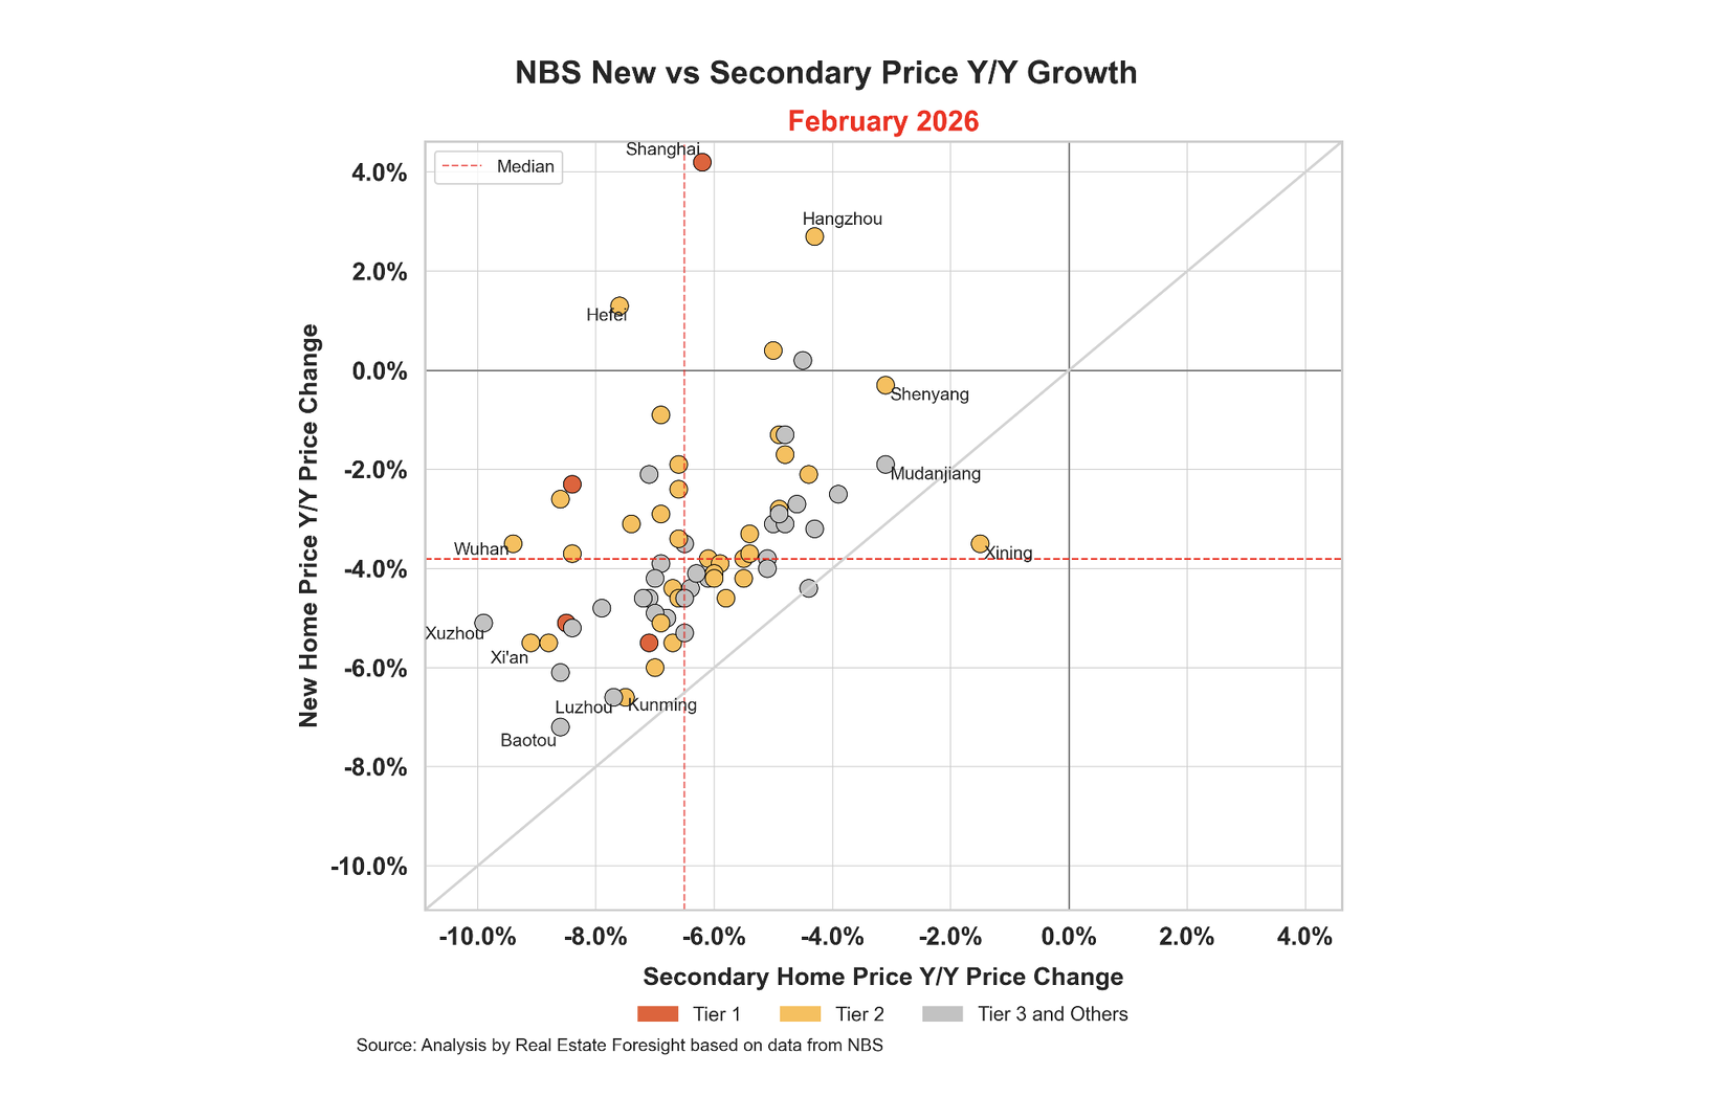
Shanghai stands out with the biggest difference, with new home prices reported as +4.2% in contrast to -6.1% for the secondary market.
A few factors are at play:
-Sales of new homes generally shifted to higher-end products, as volumes dropped in the downturn; the positive growth reflects such a composition shift rather than a like-for-like change
-Secondary market is subject to no restrictions (formal or practical) on price 'discounts', allowing for greater declines
-Secondary sales volumes are strong - a function of, on one hand, people offloading 'extra' properties, and, on the other, the buyers' motivation to get better deals and avoid the pre-sales model with risks around delivery by (distressed) developers