China Property Signals (#44): Secondary Home Prices - Any Signs Of Improvement?
About this Newsletter: Get a quick but more granular view of (still) one of the most important sectors in China, with the weekly chart and commentary from Real Estate Foresight (REF) - drawing on 14+ years of REF's research on China housing markets.
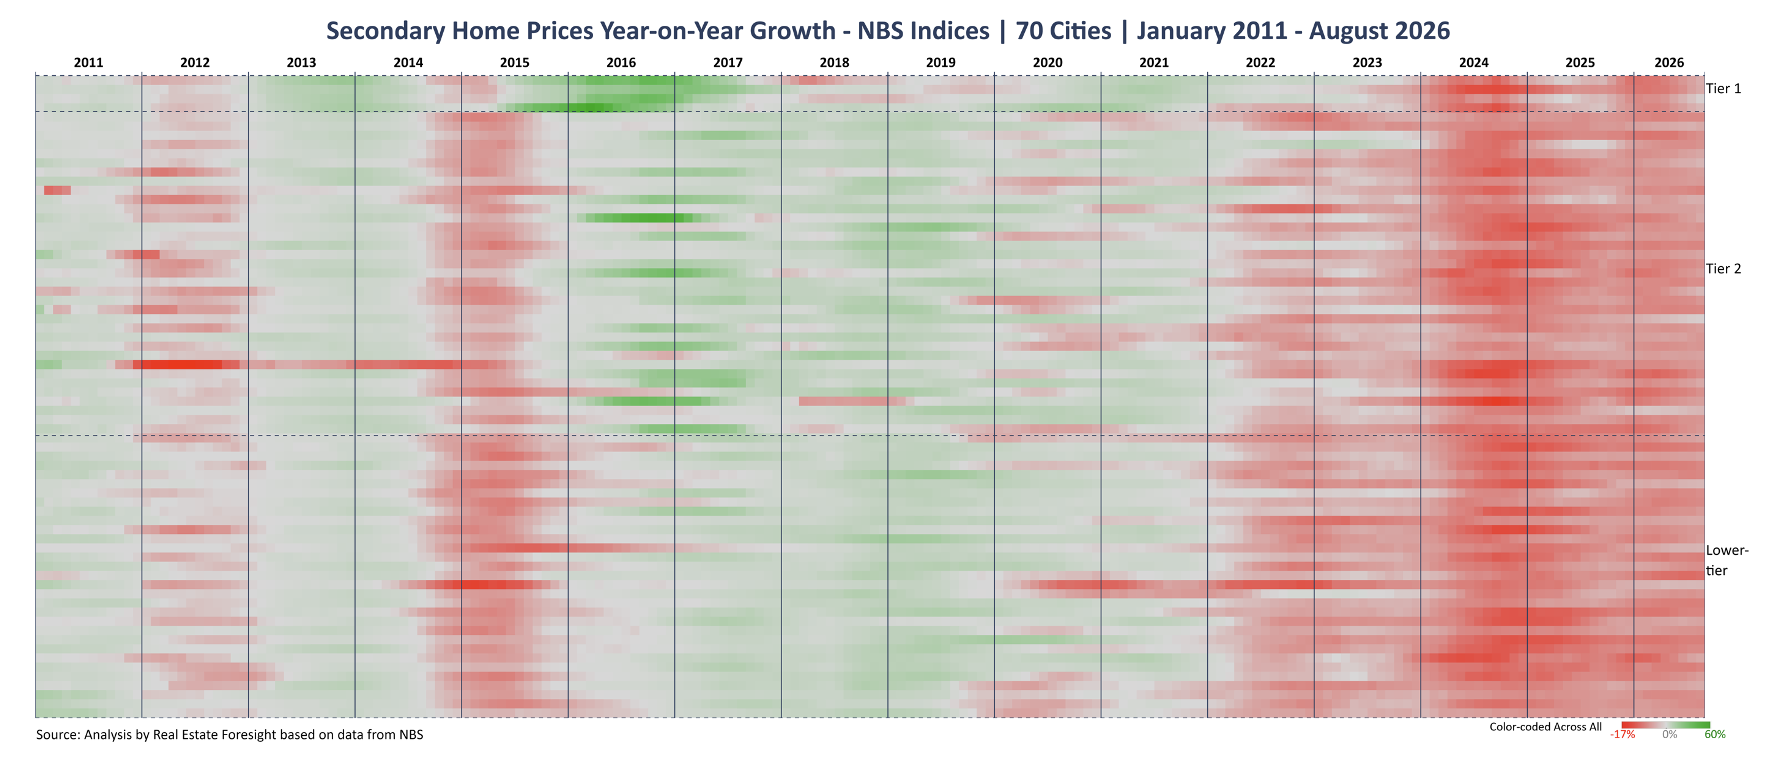
To put the current market into a longer-term perspective on secondary home price changes y/y (NBS secondary home price growth indices), see the heatmap below (here we use red for negative growth, green for positive, colour-coded across the full history), where each tiny row represents a city (70 cities), and each tiny column represents one month, starting from January 2011, all the way to August 2026 (latest data):
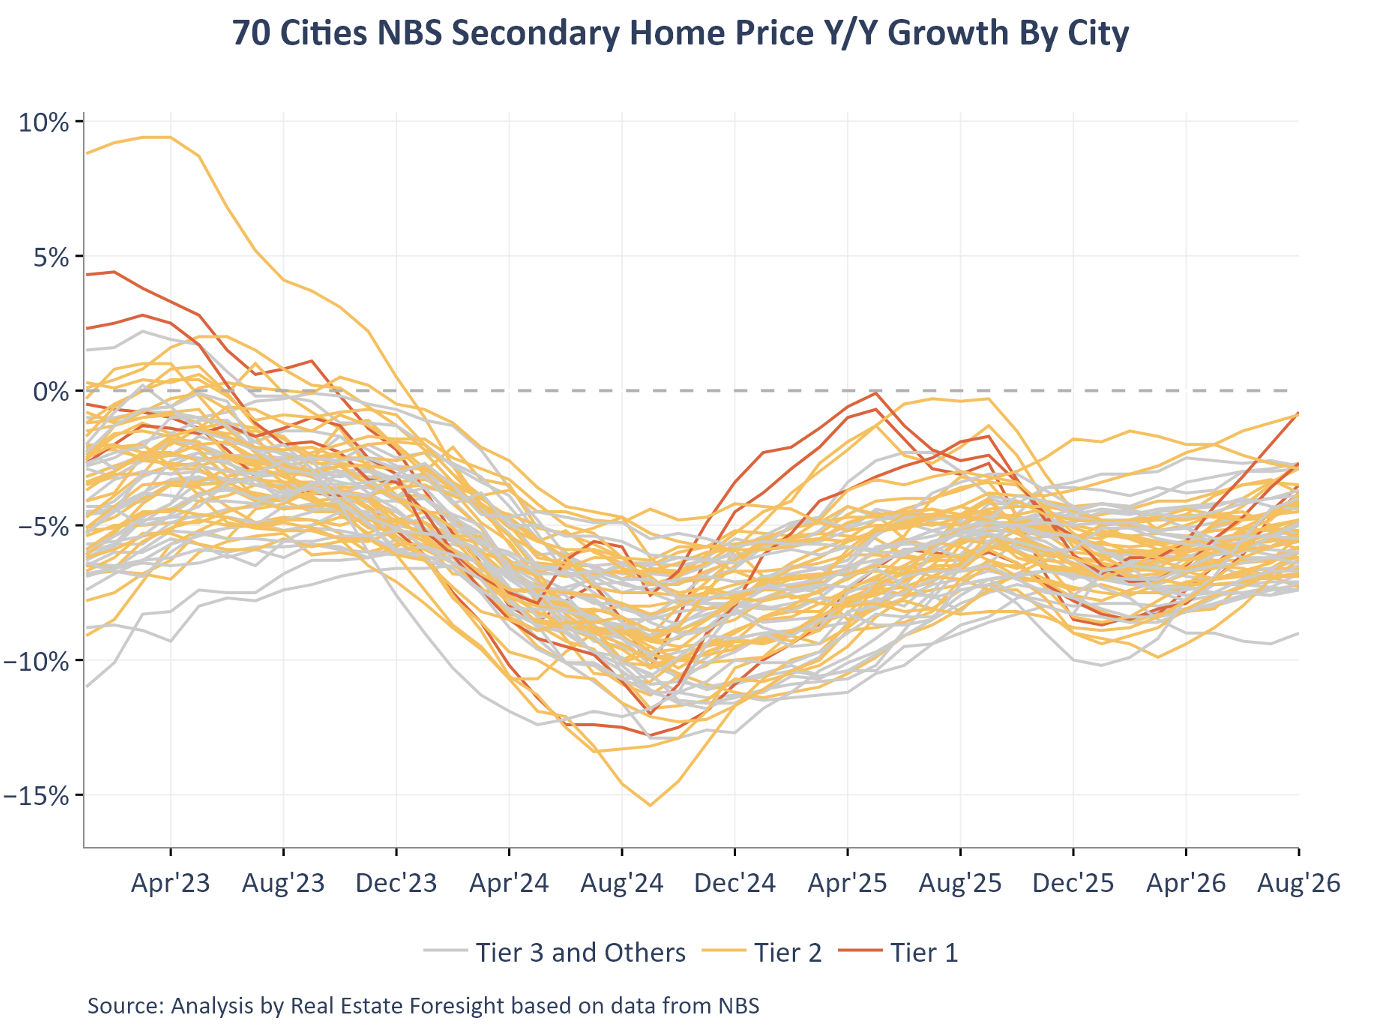
Secondary home prices have not been subject to the same caps/floors as primary homes, and for many cities, the 40-60% declines from the peak are typical. At the aggregate city index levels (where we have NBS data), the decline percentages are smaller but give a good indication of the direction (here Aug 2022 to Aug 2026):
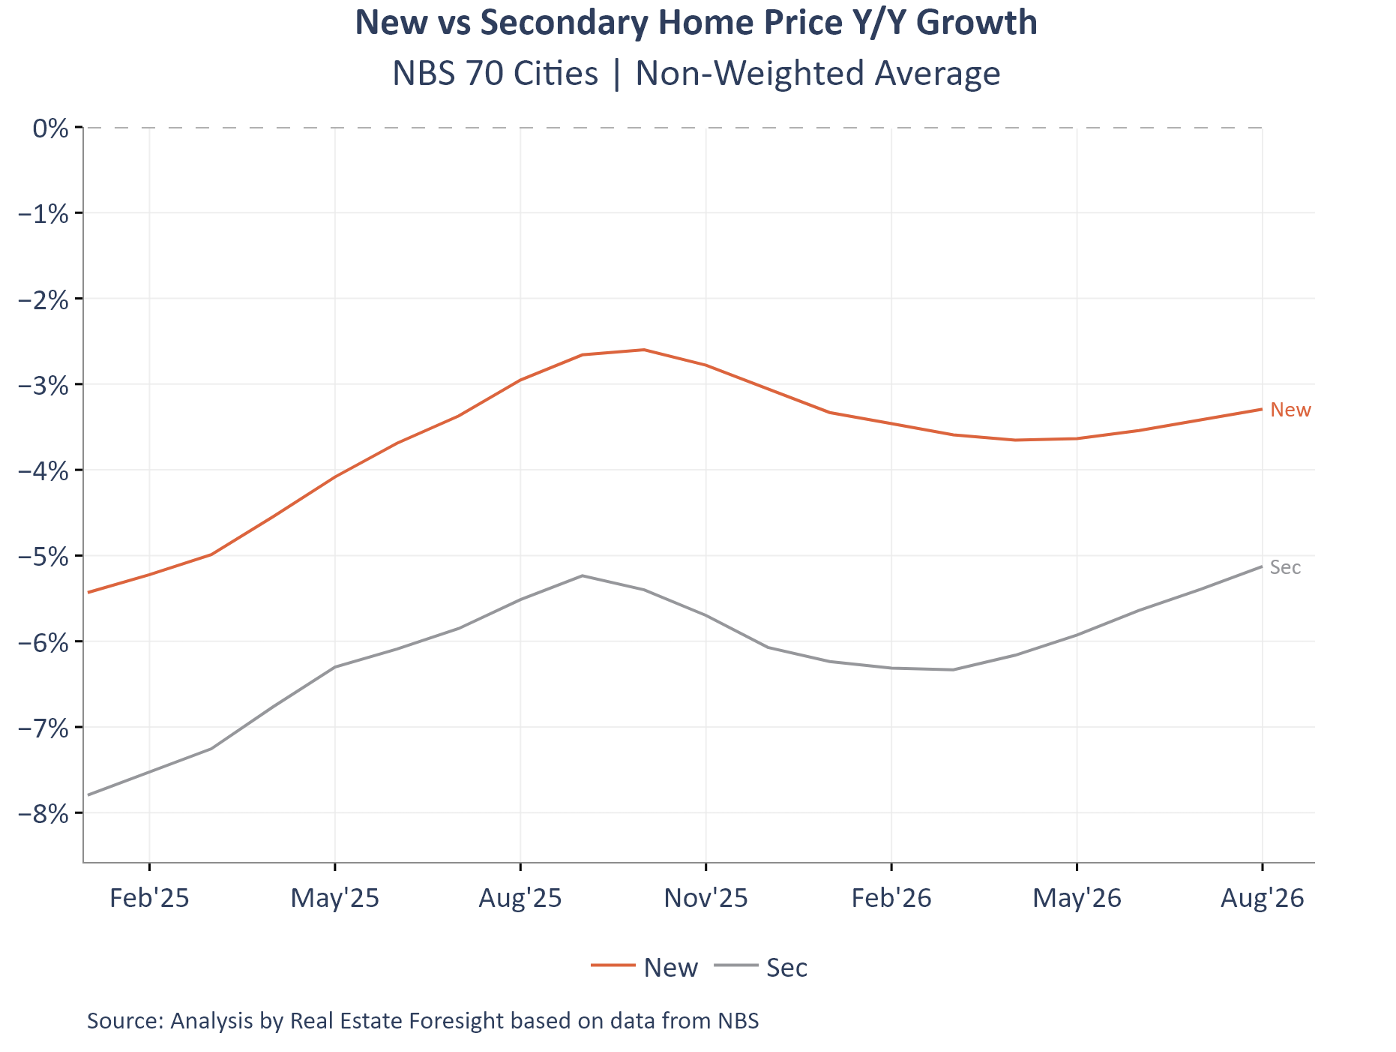
And the direction has recently been 'less negative' (y/y), though still in significant decline. At an aggregate level (non-weighted average for 70 cities), in comparison to the equivalent for new homes (here Feb 2025 to Aug 2026):
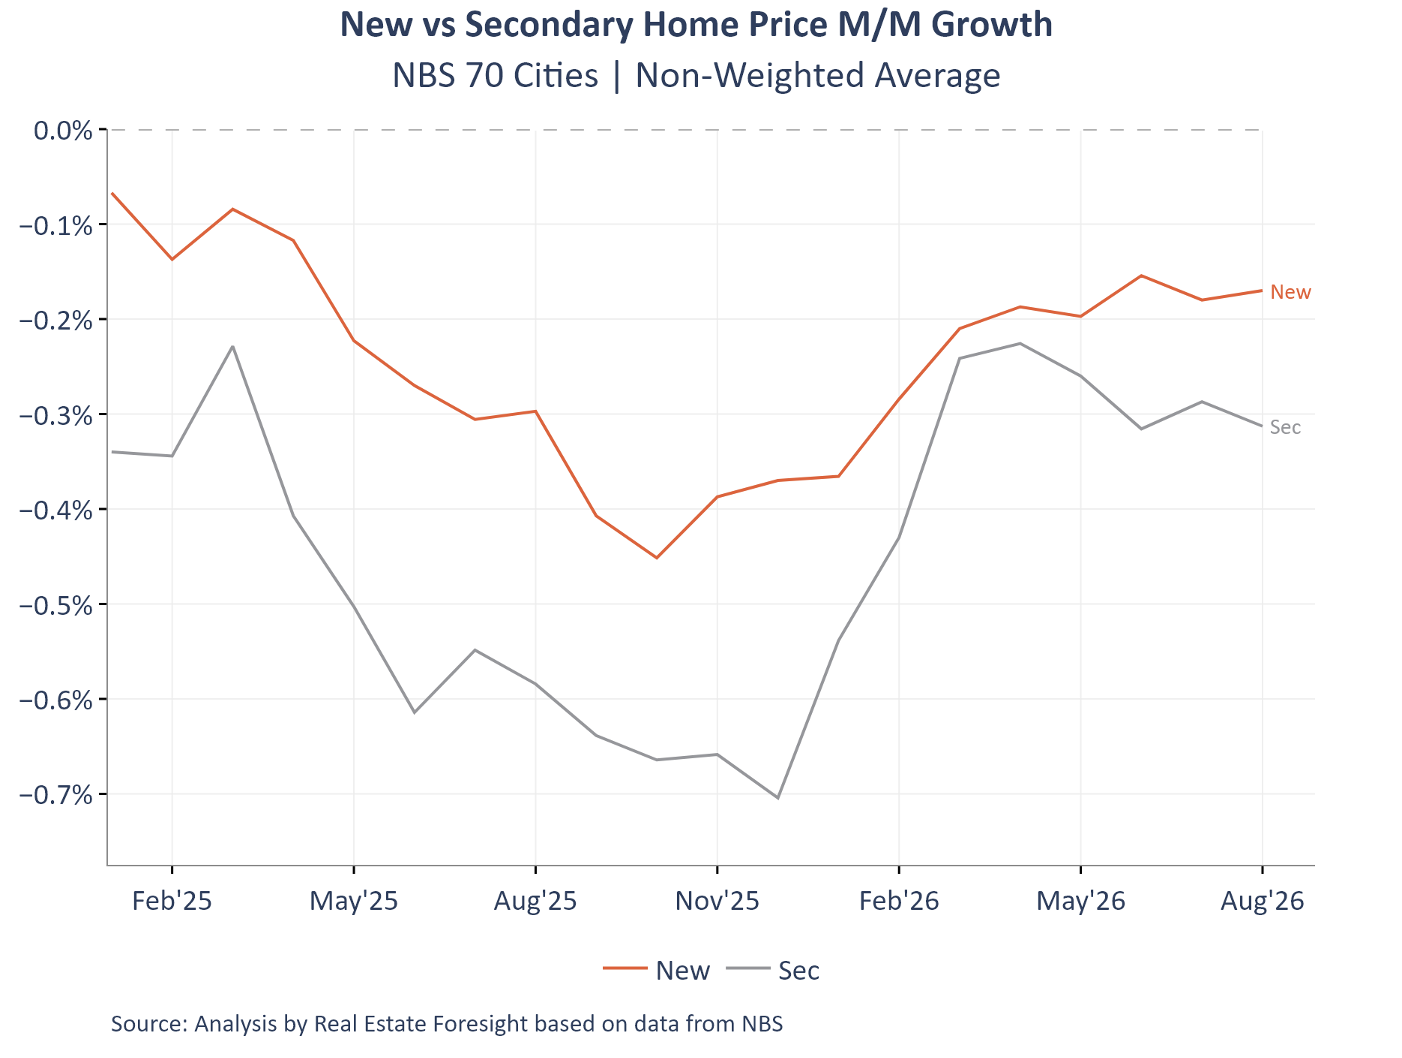
And the same picture on a m/m basis - still awaiting any real improvement (Feb 2025 - Aug 2026):
These are extracts from REF's Data Update published to clients after the data release on Sep 15, 2026. To discover more about our work on China property, please message Robert Ciemniak directly