China Property Signals (#49): The Gap Between Primary Sales Decline vs Secondary Growth Widens (YTD), Price Declines Less Negative (Y/Y)- Oct Data
About this Newsletter: Get a quick but more granular view of (still) one of the most important sectors in China, with the weekly chart and commentary from Real Estate Foresight (REF) - drawing on 14+ years of REF's research on China housing markets.
Three charts on China housing based on the Jan-Oct 2026 official data released earlier today by NBS (National Bureau of Statistics).
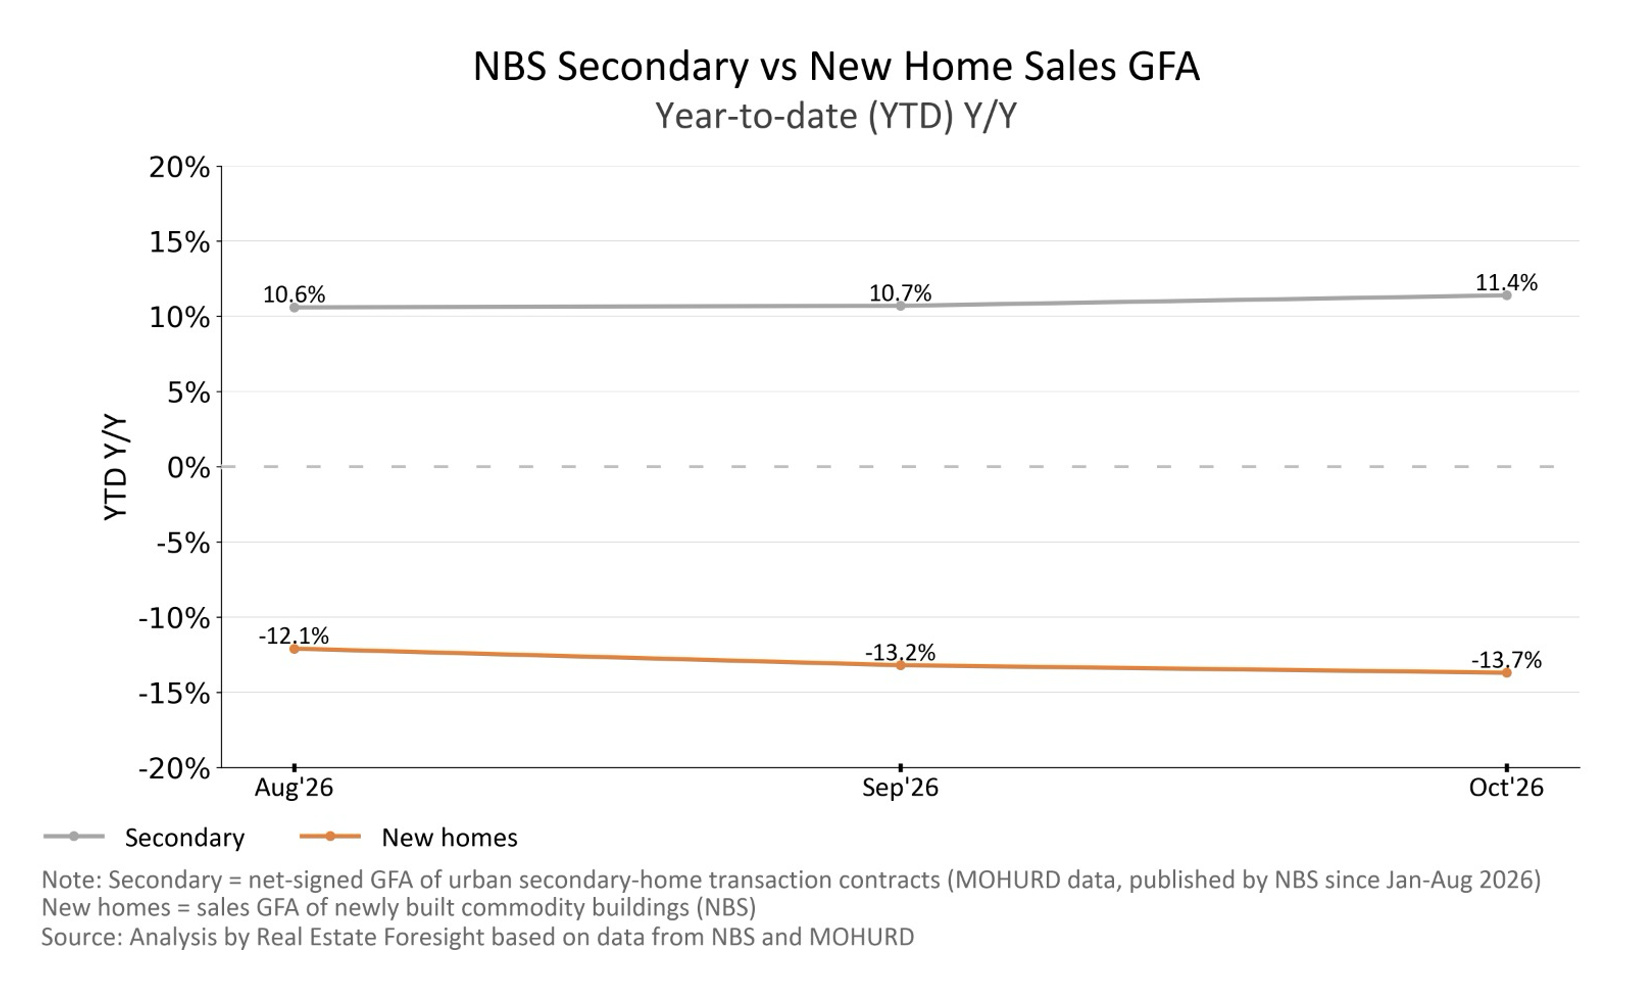
1. The contrast between primary sales volume decline and the secondary sales volume growth widened (YTD Y/Y). The data for national-level secondary home sales only started getting released officially in September (for Jan-Aug), which is in itself quite telling about the 'primary-to-secondary' shift:
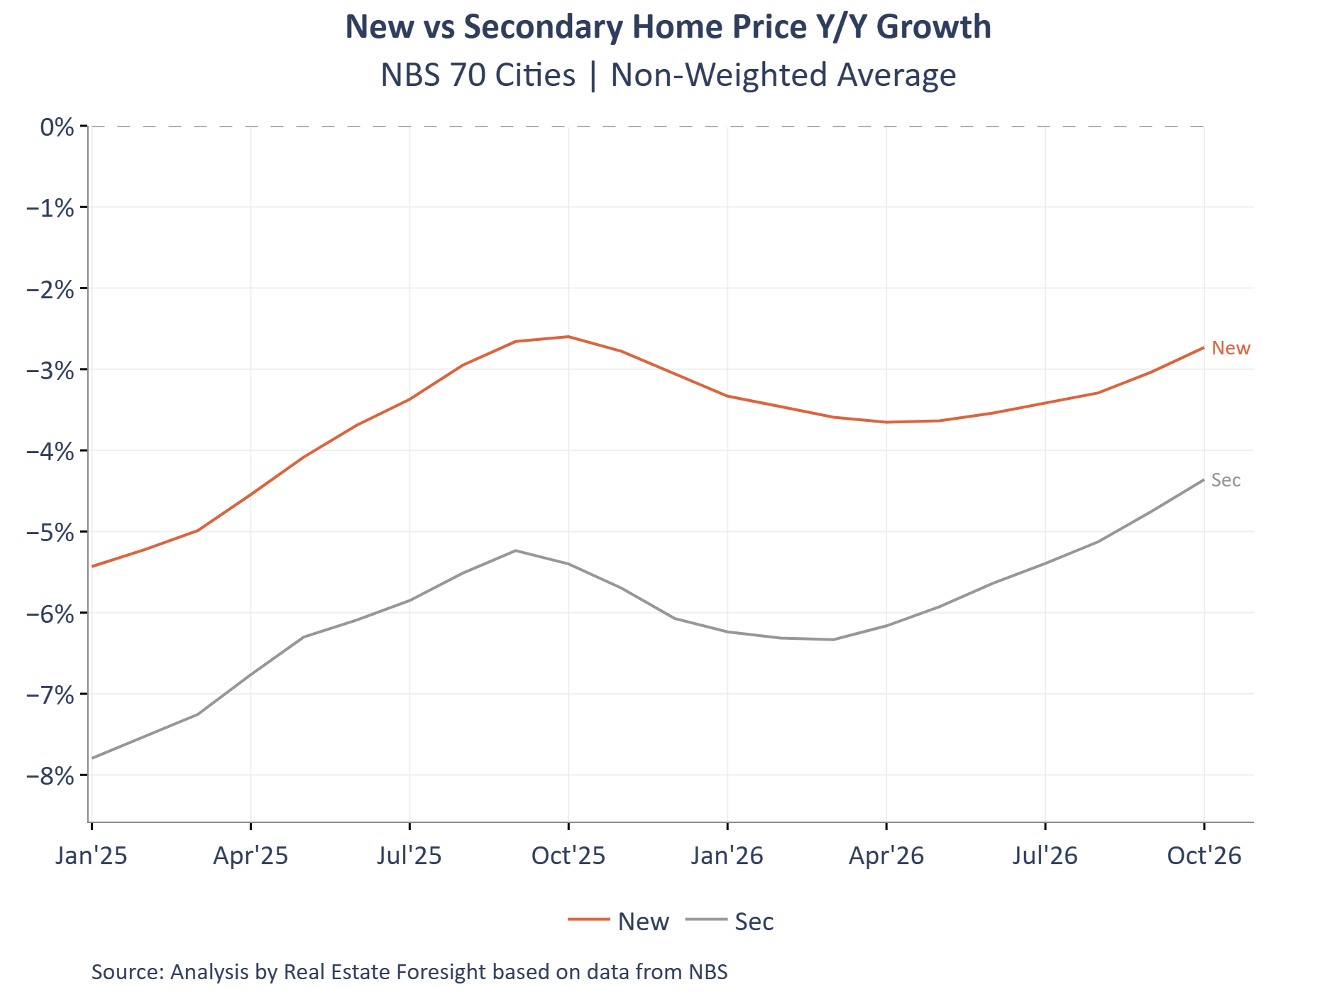
2. Home price declines (Y/Y) continue turning less negative for both primary and secondary:
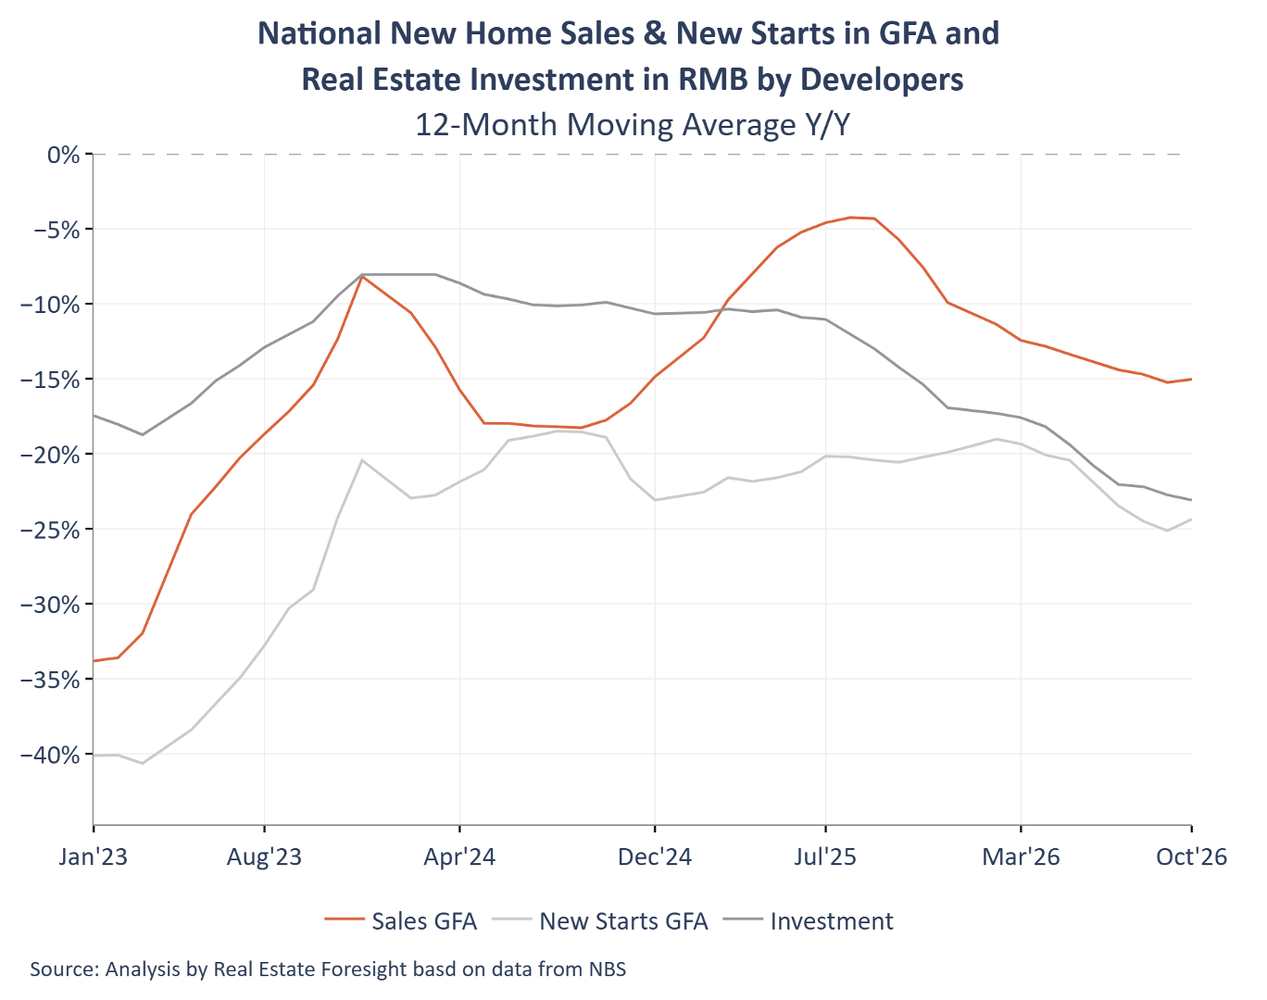
3. On a 12-month basis (latest 12M vs prior 12M), the main 'macro-property' indicators show a slightly less negative pace of decline for primary sales and new starts, but more negative for investment:
To discover more about our work on China property, please message Robert Ciemniak directly or visit https://www.realestateforesight.com